Customer Service Metrics You Can Easily Track and Measure
Customer service metrics are indicators we use to judge how well our interactions meet customer needs and expectations. These counts help us understand quality, timing, and outcomes across every touchpoint.
They show us where we succeed, where we fall short, and how our customer experience can grow. They also guide our groups toward steady progress and stronger relationships with customers.
Keep reading to learn how each indicator builds a clearer and healthier service flow.
Why Do Customer Service Metrics Matter?
Customer service metrics show what works well and what needs to change. When our figures rise or fall, we get clues about steps we should take.
These metrics help us catch issues early and keep our service flow stable.
We also use these metrics to protect long-term relationships.
When customers get timely assistance and thoughtful support, they stay with us longer and trust our offering more.
Better service leads to higher satisfaction and stronger loyalty. These outcomes support growth because customers feel cared for and heard.
Metrics also assist us in spotting trends before they grow into bigger issues. A slow rise in wait times, a dip in satisfaction, or a shift in sentiment can show us where to look.
With this early view, we can correct problems before they reach others.
Along with benefits for customers, these measures of customer service aid in our people growth. They show where we need clearer internal steps, better guidance, or more training.
Customer metrics bring clarity to decisions and keep our customer experience grounded in real feedback.
The Types of Customer Service Metrics Out There
Customer service metrics are split into two main groups: operational gauges and experience gauges. Both groups bring different insights, and when we use them together, we get a full picture of performance.
Operational gauges describe what happened. These include reply speed, case volume, and resolution speed. They give us concrete values we can compare across time.
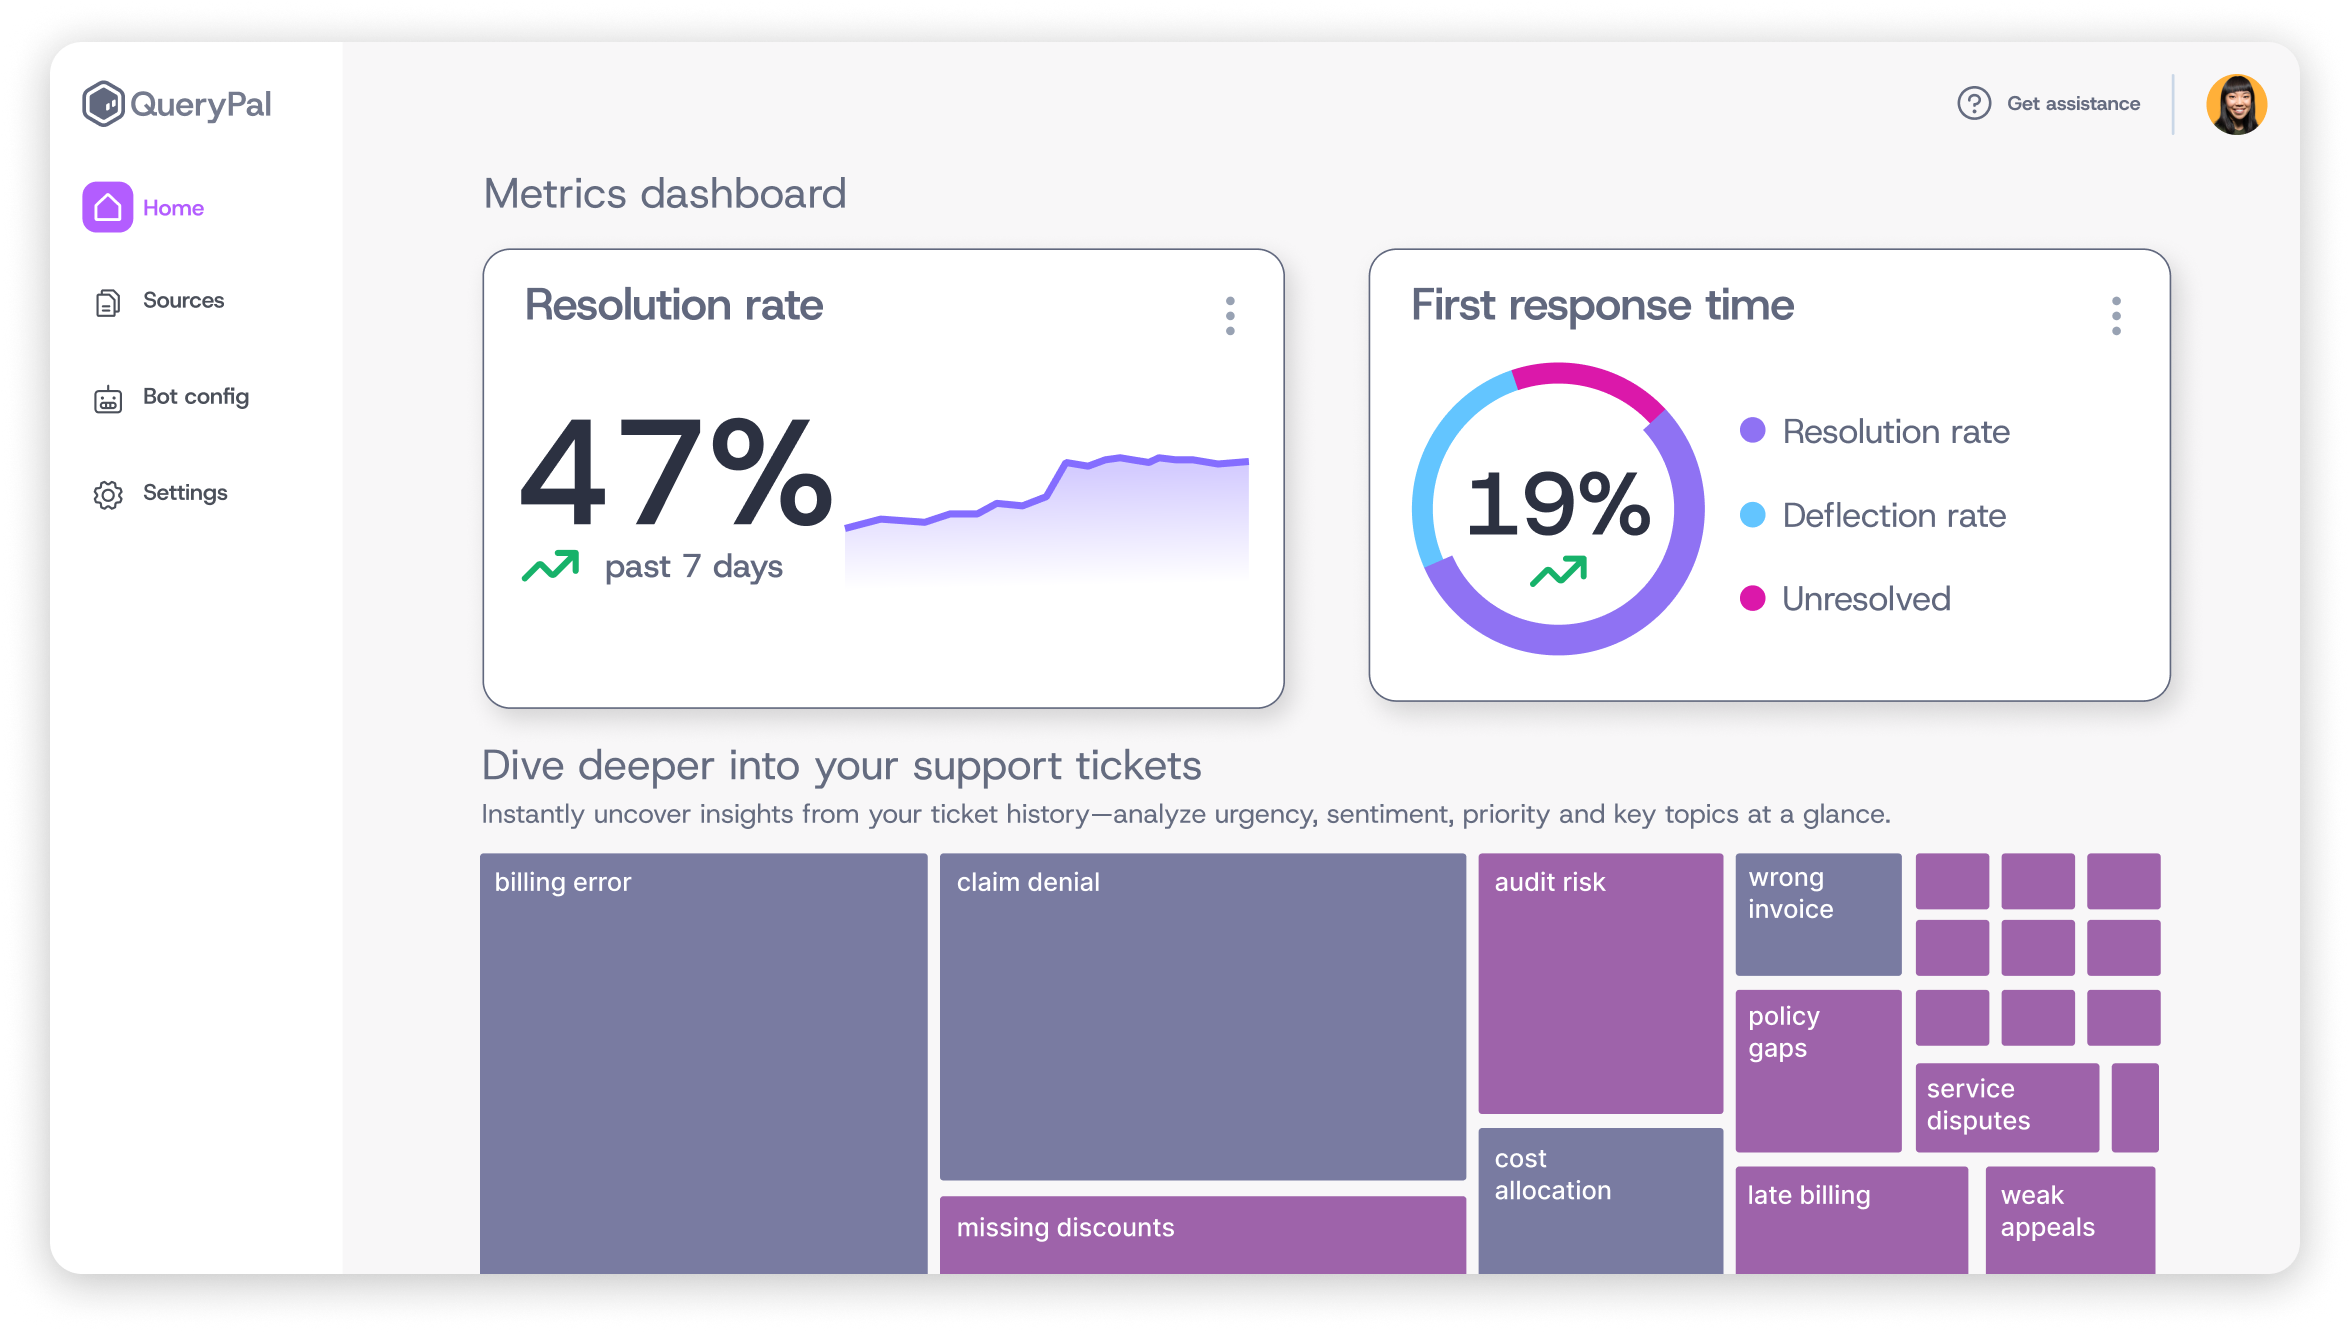
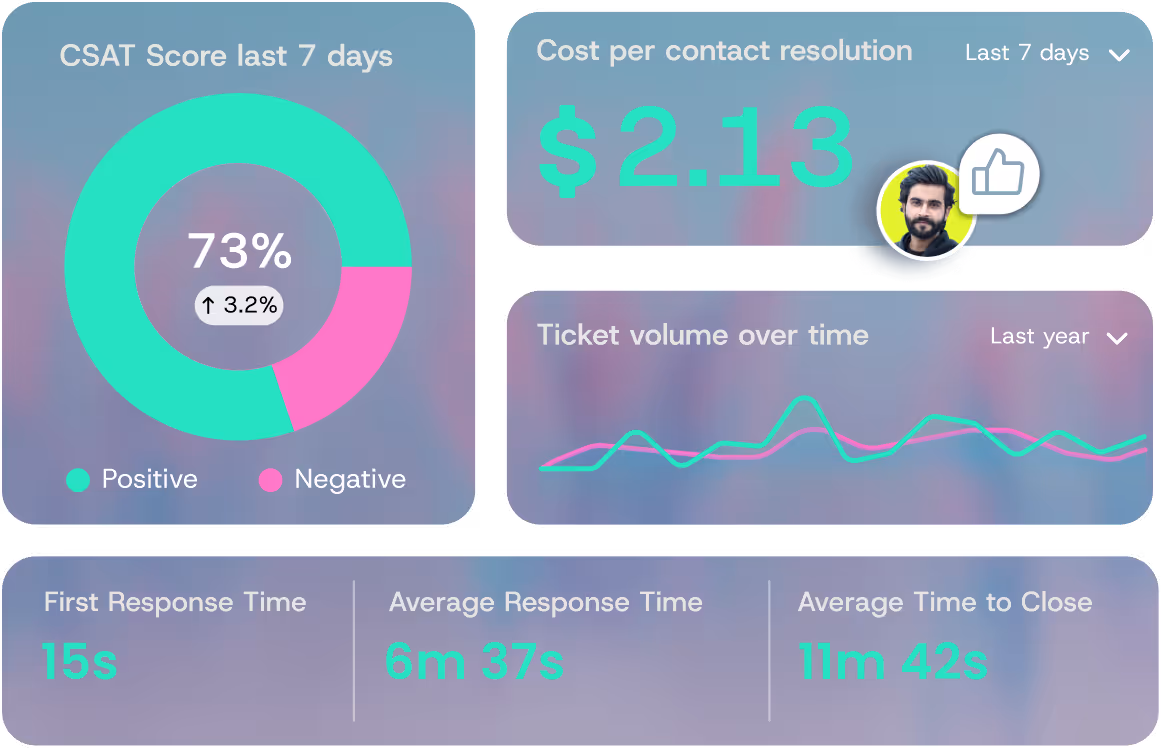
For example, QueryPal tracks operational metrics like first response time and ticket volume automatically through its analytics dashboard, giving teams real-time visibility into performance trends.
Experience gauges describe how customers feel. These include satisfaction, loyalty, sentiment, and effort. They make us understand customer expectations and emotional responses better.
QueryPal enhances experience measurement by analyzing customer sentiment during interactions and identifying friction points that impact satisfaction scores, helping teams proactively address issues before they escalate.
We use both groups because one without the other can hide important information. For example, quick replies may look good, but customers may still feel confused or unhappy.
Likewise, customers may feel happy even when reply times are slow, but that may change once volume grows. AI ticketing systems help balance both operational speed and experience quality by routing tickets intelligently.
How Do You Measure Customer Satisfaction?
Customer satisfaction metrics create a picture of whether our service meets customer needs and where we may need to adjust. These indicators show how customers feel after key moments and aid us in guiding improvements with steady steps.
Understanding how to measure customer experience through these key indicators is essential for service excellence.
Customer Satisfaction Score (CSAT)
A CSAT score measures how satisfied customers feel after an interaction. We keep the survey simple by asking one question on a 1-5 scale. Higher values show better satisfaction.
To calculate the CSAT score, we divide satisfied responses (4 or 5) by all responses, then multiply by 100. We review this result over time to see whether our actions improve short-term experiences.
For more accurate results, we send the survey right after the interaction and keep it brief. When scores dip, we add a quick follow-up question so customers can explain the reason. Short replies help us find direct fixes.
Net Promoter Score (NPS)
NPS measures how likely customers are to recommend us. We ask one question on a 0-10 scale, then categorize the answers into:
- Promoters (9-10): likely to recommend
- Passives (7-8): neutral
- Detractors (0-6): unhappy or unsure
We subtract the percentage of Detractors from the percentage of Promoters to get the NPS score. We send NPS surveys at steady intervals to track long-term loyalty, not single interactions.
Short open comments enable us to understand the reasons behind each score.
Customer Effort Score (CES)
CES shows how easy it is for customers to get help or complete tasks. Lower effort often leads to repeat use, while high effort can push customers away.
We gather CES right after key steps such as support calls, checkout flows, or setup steps. If customers report high effort, we look for patterns such as repeated steps or unclear instructions and adjust our flow to remove friction.
Together, CSAT, NPS, and CES give us a clearer view of customer feelings, long-term trust, and ease. By watching all three customer experience measurements, we can act with confidence and improve the experience steadily.
Here Are Some Response and Resolution Metrics
These metrics show how quickly and completely we meet customer needs. They enable us to understand the pace of our service, the clarity of our steps, and the quality of our solutions.
When we monitor them together, we see where customers move through our process without trouble and where they get stuck.
First Response Time
First response time measures how long it takes for us to acknowledge a customer's first message. This timing matters because it shapes the first impression of the interaction.
Even if the full answer takes longer, the first reply shows presence, awareness, and care.
Different channels carry different expectations, and customers shape their reaction around these norms:
- Email replies often fall within a day
- Social channels need faster oversight
- Live chat creates expectations of near-instant replies
Meeting or exceeding these expectations enables customers to feel seen rather than ignored. When this figure rises, we check for patterns such as peak hours where response may slow, new issues causing spikes, or steps that create delays.
Tools like QueryPal aid in reducing reply time through page-aware intelligence and intuitive action, allowing us to respond in real time when volume grows.
Average Resolution Time
Average resolution time shows how long it takes to fully solve an issue from start to finish. This metric gives clarity into the depth of each case.
Faster resolution often means our steps are clear, our guidance is easy to follow, and our system behaves as expected.
Long times can happen for many reasons. The issue may require checks across departments, or it may involve complex questions.
Sometimes our agents may need clearer internal notes or updated instructions.
We split resolution time by issue type so we can see which areas need more structure.
When totals rise, we look for themes, review our workflow, and assist the crew in adjusting steps that slow progress. Modern customer support automation can significantly reduce resolution times by handling routine queries instantly.
First Contact Resolution Rate
First Contact Resolution (FCR) tells us how often we solve an issue in the first interaction. Customers prefer when answers come quickly without passing through multiple touchpoints.
We calculate FCR by dividing the number of cases solved on the first contact by the total number of cases received, then multiplying by 100 to express it as a percentage. For example, if your team resolved 80 out of 100 cases on first contact, your FCR would be 80%.
A higher rate usually means our information is clear, our agents are prepared, and our steps align well with customer needs.
When this rate drops, we check for unclear instructions, missing guidance, or issues that require too many follow-up steps. By improving these areas, we make our service simpler and smoother.
What Are Some Operational Efficiency Metrics?
Operational indicators enable us to understand how much work comes in and how our flow handles it. These metrics empower us to judge our workload and see where volume rises or falls.
Learning how to quantify customer service through operational metrics helps teams allocate resources effectively.
- Ticket Volume — Ticket volume shows how many requests we receive during a set period. Rising counts may mean changes, confusion points, or seasonal events. Enterprise companies can address volume challenges by implementing smarter routing and ticket deflection strategies.
- Ticket Reopens — Ticket reopens show how often cases reopen because customers still need assistance. High reopen levels may show unclear answers or persistent issues.
- Agent Touches — Agent touches count how many times we update or check a case. High touch levels can show complexity or gaps in our steps.
Customer Loyalty and Retention Metrics
Customer loyalty indicators serve to easily understand how long customers stay with us and why they leave. Since loyal customers drive growth, these metrics serve us in maintaining the health of our customer base.
These are critical measures when evaluating how is customer service measured over time.
Customer Churn Rate
Churn rate shows how many customers leave within a set time frame. To calculate this figure, we divide the number of customers lost during a period by the total number of customers at the start of that period, then multiply by 100 to get a percentage.
For instance, if you started with 500 customers and lost 25 during a month, your monthly churn rate would be 5%.
When churn rises, we study comments from exit surveys or cancellation notes to understand the reasons behind the choice.
Customer Retention Rate
Retention rate tells us how many customers stay with us. We calculate it using this formula: take the number of customers at the end of a period, subtract any new customers acquired during that period, divide by the number of customers at the start, then multiply by 100.
For example, if you started with 500 customers, gained 50 new ones, and ended with 480 total customers, your retention rate would be [(480-50)/500] × 100 = 86%.
Retention is important because holding on to current customers costs far less than gaining new ones. Understanding customer service transformation can help improve retention rates significantly.
Customer Lifetime Value (CLV)
CLV tells us the total revenue a customer brings across their entire relationship with us. We calculate it by multiplying three factors: average purchase value, purchase frequency per time period, and average customer lifespan measured in those same time periods.
For example, if customers spend $100 per purchase, buy 4 times per year, and stay for 3 years on average, the CLV would be $100 × 4 × 3 = $1,200.
When we know CLV, we can place our effort where it matters most.
Social Media and Sentiment Metrics: What Are They?
These metrics show how customers feel and how they speak about us in public spaces. This enables us to maintain a healthy brand image and catch early signs of frustration. These metrics give us a steady flow of raw customer thoughts.
- Social Media Mentions — Social mentions track how often people talk about us, ask questions, or report issues. We follow both positive and negative comments.
- Customer Sentiment — Sentiment analysis reviews emotional tone across comments or messages. We group feedback as positive, neutral, or negative. Tracking these levels shows trends in customer mood.
How to Choose the Right Metrics to Track
Choosing the right indicators empowers us to focus on what matters most. Not every value adds insight, so we begin by picking a small group that connects to our main challenges.
We usually begin with three to five metrics. These match our goals and show clear impact. As we grow, we add more advanced indicators that give deeper detail.
We avoid vanity metrics. We select figures that lead to steps or changes, not totals that simply look good.
When we choose these indicators, we also think about agents' readiness. A newer team may begin with simple satisfaction and reply values. A more advanced team may add sentiment, loyalty, and efficiency standards.
How to Measure Customer Service Metrics
We gather these metrics through surveys, platform tracking, and social monitoring. These sources aid us in collecting data across different interaction types.
Our intelligence layer in QueryPal helps us gather many of these gauges with real-time accuracy. With page-aware intelligence, our system understands context, customer intent, and event flow.
This keeps data clean and makes reading results easier for our staff.
We also set steady review cycles. Some gauges work well with a weekly review, while others work better monthly or quarterly. Over the periods, these reviews reveal patterns.
We may also share metric updates with our staff. This helps everyone understand progress and know where to focus. When our people see clear values, they take clear steps.
Organizations across financial services, healthcare, and SaaS use these measurement approaches to drive continuous improvement.
Turning Metrics Into Action
Metrics only matter when we use them to make real changes. We share values across our teams and explain their meaning. When our people see the outcome of these gauges, they understand the next steps.
We connect improvements to action. If satisfaction dips, we find out why and fix it. If wait periods rise, we check our flow, adjust staffing, or simplify steps where possible.
These improvements lead to smoother customer experiences. Our team grows, our system becomes easier to use, and customers trust us more.
QueryPal supports these efforts through intuitive action and proactive interception. Our system uses self-driving experience paths to help customers get answers quickly.
Our agentic AI capabilities help guide our people without extra work. By blending gauges with continuous learning, we make our platform a partner rather than a simple system.
Ready to transform how you measure and improve customer service? Book a demo to see how QueryPal can help you track the metrics that matter most.
References
- IT Modernization Centers of Excellence. "How to Measure Contact Center Performance." GSA Government Services Administration, 28 May 2019, coe.gsa.gov/2019/05/28/cc-update-2.html. Accessed 4 Dec. 2025.
- Sivasubramanian, Raj. "Are Your CX Metrics Hurting Your Customer Experience?" MarTech, 20 Jan. 2025, martech.org/are-your-cx-metrics-hurting-your-customer-experience/. Accessed 4 Dec. 2025.

Activate your free
6 week trial
& white-glove integration support.
Cut support costs by 60%, slash response & resolution times, improve your customer experiences, & reduce agent burnout. Find some time with us to show you how.